Excel Tutorials | Starting to use MS Excel | #ExcelTutorials
https://global-fintech.blogspot.com/2016/05/how-to-use-excel.html
I suppose it would be useless now to explain from scratch what Microsoft
(MS) Excel is. Everyone, at least once in their life, has used it. Or any other
spreadsheet programme such as LibreOffice Calc. Nevertheless, it would be worth
starting this series of Excel tutorials by some introduction to MS Excel.
 |
| Excel Tutorials | Introduction to MS Excel and Excel Formatting |
What is MS Excel?
A spreadsheet is a collection of individual data cells that
enable the user to store data, perform calculations, and visualise data.
MS Excel is a spreadsheet programme from Microsoft that allows
us to automatically collect, group and interpret different data, make all sorts
of quick and flexible calculations with them inside one or many worksheets or
even documents and visualise the results .
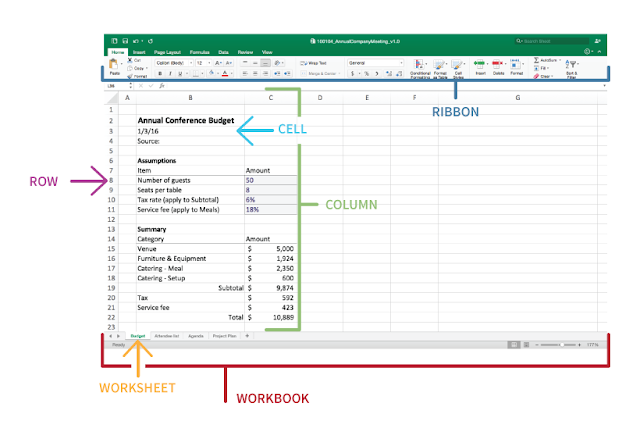
Excel Main Components
 |
| Key components of Excel formatting |
Let’s look at the key components of MS Excel which we are
going to work with:
-
cells
-
columns
-
rows
-
worksheets
-
workbooks
-
ribbon.
Excel Cells –> Columns x Rows
Cells are
individual ‘boxes’ where information is stored which are named according to
their placement (e.g., cell B3 located in column B, row 3). Stored information
may include input values, calculated values,
or descriptions.
Columns are
vertically aligned series of cells (e.g., Column C).
Rows are
horizontally aligned series of cells (e.g., Row 8).
Excel Worksheets vs. Workbooks
Worksheets are
single spreadsheets, more precisely, ‘tabs’ in a workbook file (e.g., ‘Budget’
worksheet).
Workbooks are
collections of related worksheets saved as one file (e.g., the workbook file
‘160104_AnnualCompanyMeeting_v1.0’ containing worksheets ‘Budget’, ‘Attendee
List’, ‘Agenda’, and ‘Project Plan’).
Excel Ribbon
The Ribbon (also
commonly referred to as the toolbar) is the row of tabs with buttons at the top
of the worksheet view. The ribbon offers a variety of shortcut tools for editing
worksheet format, executing calculations, or visualizing data, which are grouped
in tabs by type (e.g., ‘Home’ tab of the ribbon contains tools to edit cell
formats).
The Best of Excel Formating Practices
Excel formating should be consistent, plain and easy to follow for
those who get access to our spreadsheets. Though pretty evident, the pieces of
advice to be mentioned below are not very often observed…
-
Excel File Name
-
Excel Headers
-
Excel Text Font
-
Excel Text Alignment
-
Excel Tab Labels
How to Build a Spreadsheet in Excel?
As in everything, you need planning in building a worksheet.
Building an effective and persuasive spreadsheet requires thoughtful planning.
That holds for all stages of planning an Excel worksheet. Thus, I propose the
following structure of a thoughtfully planned, focused, targeted and clear piece
of analysis.
1. Identify Purpose and Audience
What questions are you trying to answer? Who will be viewing
your analysis? Identify the ultimate purpose and audience of your analysis.
Consider if the complexity and nature of your data warrants using Excel, or
would be best suited for another tool. If you will need to share your analysis,
plan to invest in spreadsheet organization and formatting accordingly.
2. Define Target Outputs
What are the desired outputs to answer your key questions and
persuade an audience? Outputs are the values you generate through spreadsheet
calculations. Identify these key outputs as you will want to construct your
spreadsheet to calculate these outputs and format your sheet for their focused
viewing.
3. Identify Inputs
What inputs do you need to calculate your target output(s)?
Which of those inputs do you have? Which will you need to find or make
assumptions about? An assumption is an educated estimation used as an input when
the actual quantity is unknown. Before starting analysis, ensure you have
required inputs—or can make educated assumptions—to calculate outputs
4. Create a Blueprint
What will each worksheet look like? Before you jump into a
workbook, do some simple strategising. Consider how you can lay out your
spreadsheet to provide quick visibility into outputs and easy manipulation of
inputs. Pay special attention to your key analyses and how these will build upon
each other. Use a blank sheet of paper to sketch out your different worksheets.
5. Create your Spreadsheet
Once you have taken the time to carefully consider the above
points, you are ready to create your spreadsheet. Construct your worksheets by
creating organized headers and tables and adding data last. As you build your
spreadsheet, periodically test your work by altering input values and ensure
that calculations flow through into outputs as expected.